Published by Malavika Solanki
This month’s update contains the usual metrics, including an overview of the reporting trend by institution type. Looking at OTC ISIN data reported to FIRDS (see below), it’s clear that convergence (of a kind) remains the order of the day, with the gap closing further in Q2 2019.
Notably, June 2019 was the first time OTC ISINs for a cross-asset class instrument was reported, with OTC ISINs reported by 90 MICs for a total of 60 DSB Product Definitions. The number of cross-asset derivatives reported is very low at this early stage and will be an interesting one to watch.
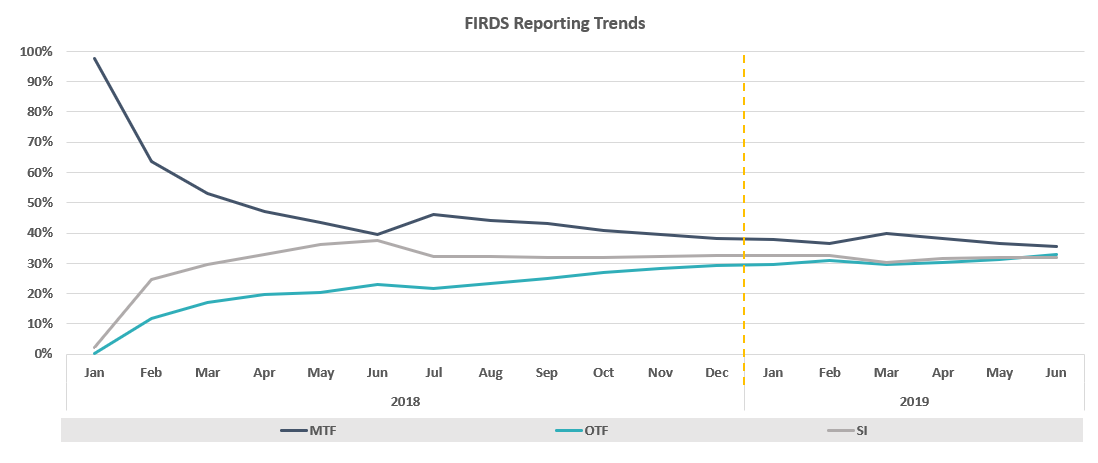
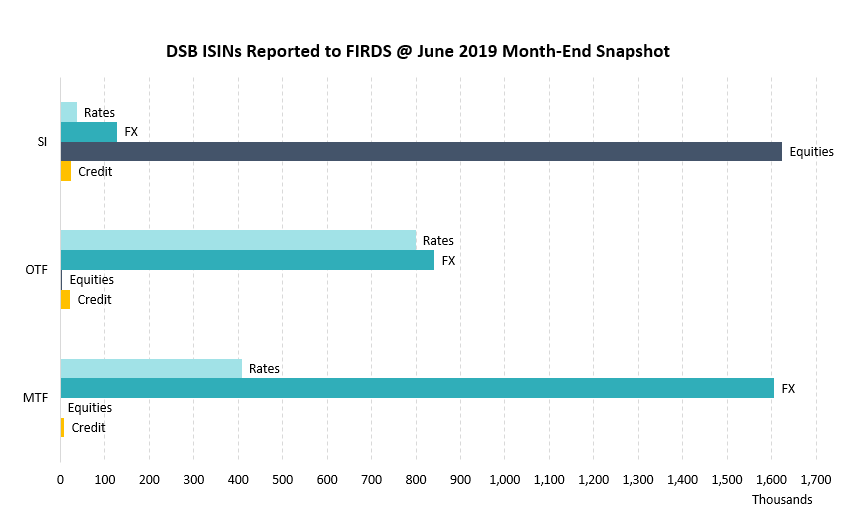
Returning to the standard data set published each month, we see that the number of active OTC ISINs in the FIRDS snapshot for June month-end was up slightly from that in March month end, driven by an increase in the level of SI reporting (up 10% quarter on quarter) and a 4% increase in the level of OTF reporting, both of which were offset by a 6% reduction in the level of OTC reporting by MTFs. The asset class level snapshot is shown below.
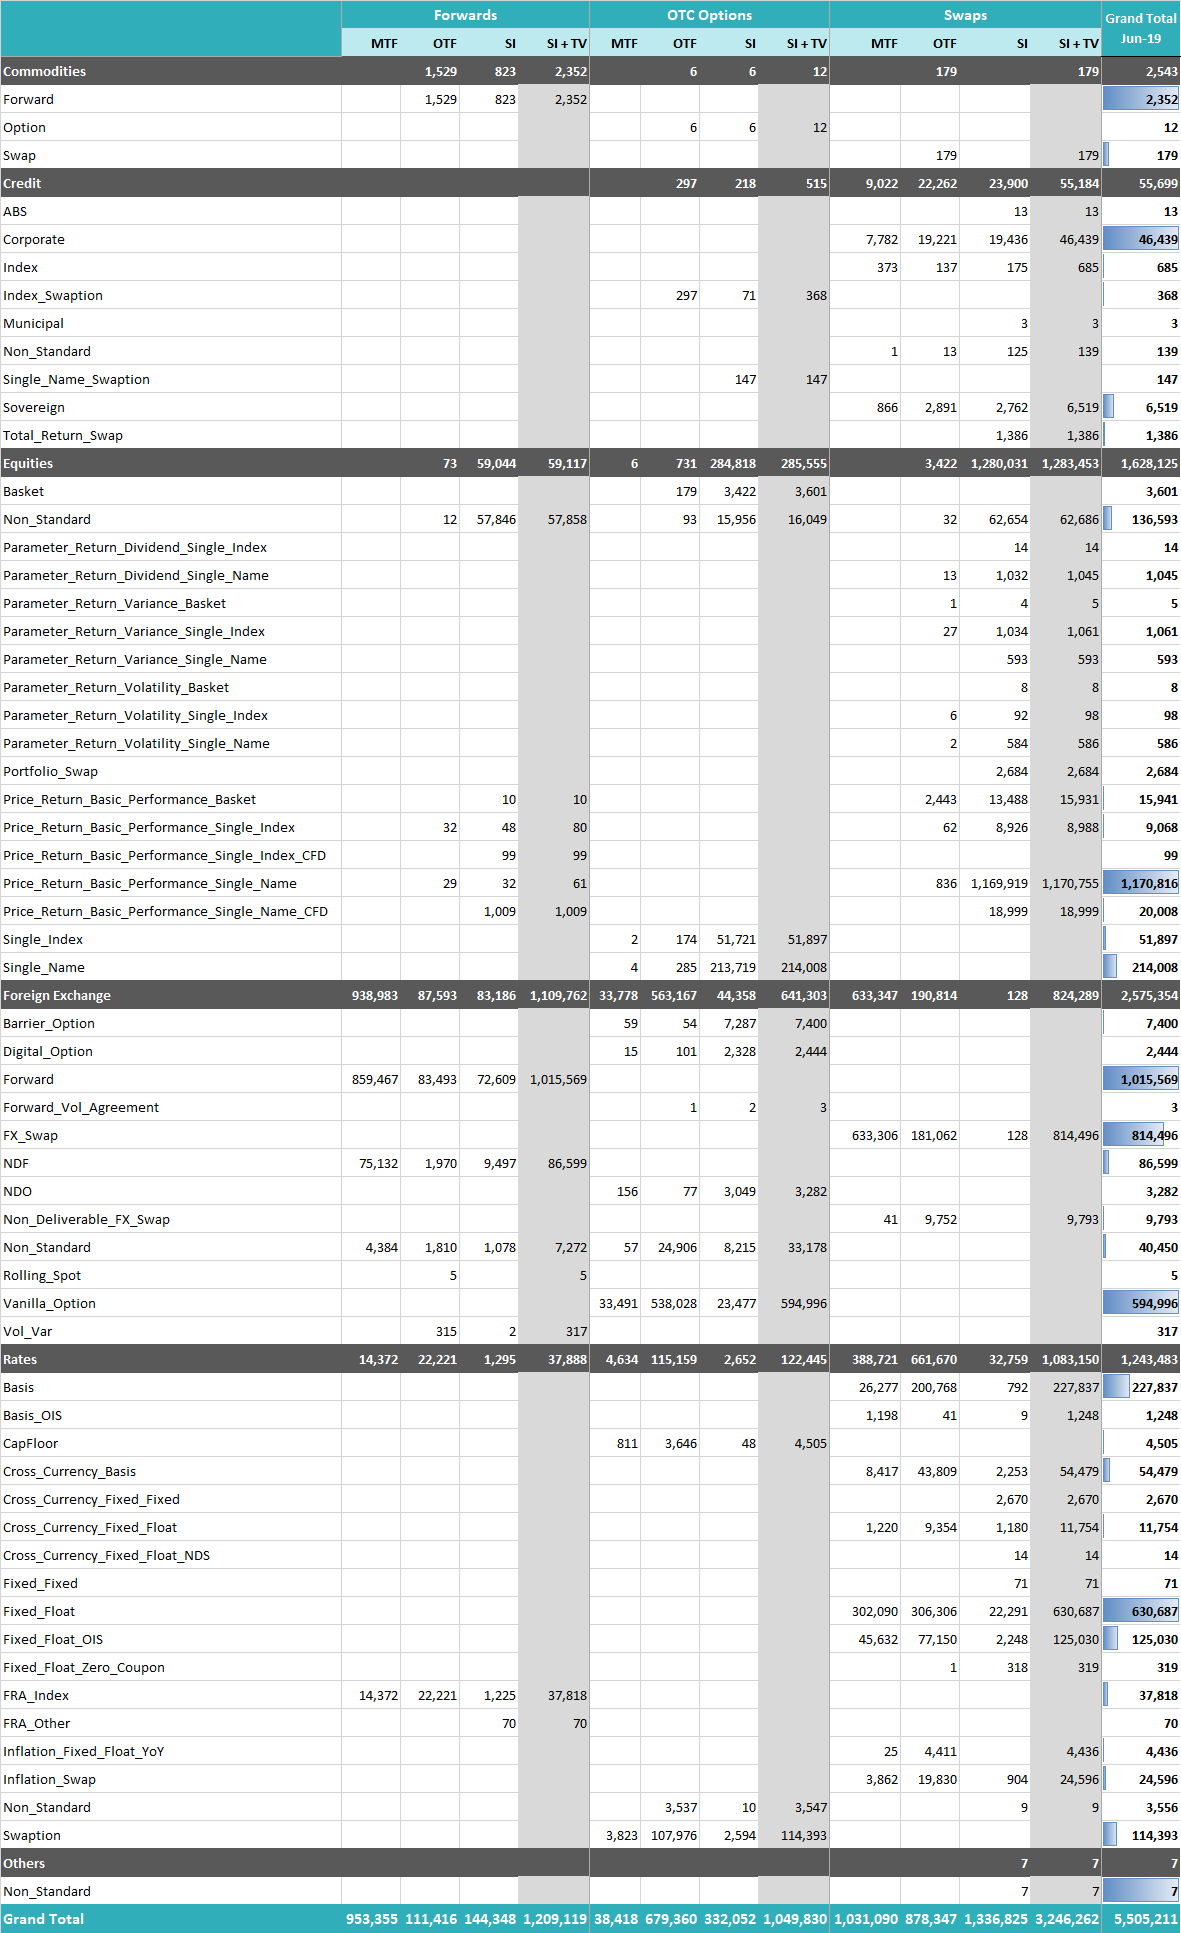
The broader product level composition is set out in the table that follows.
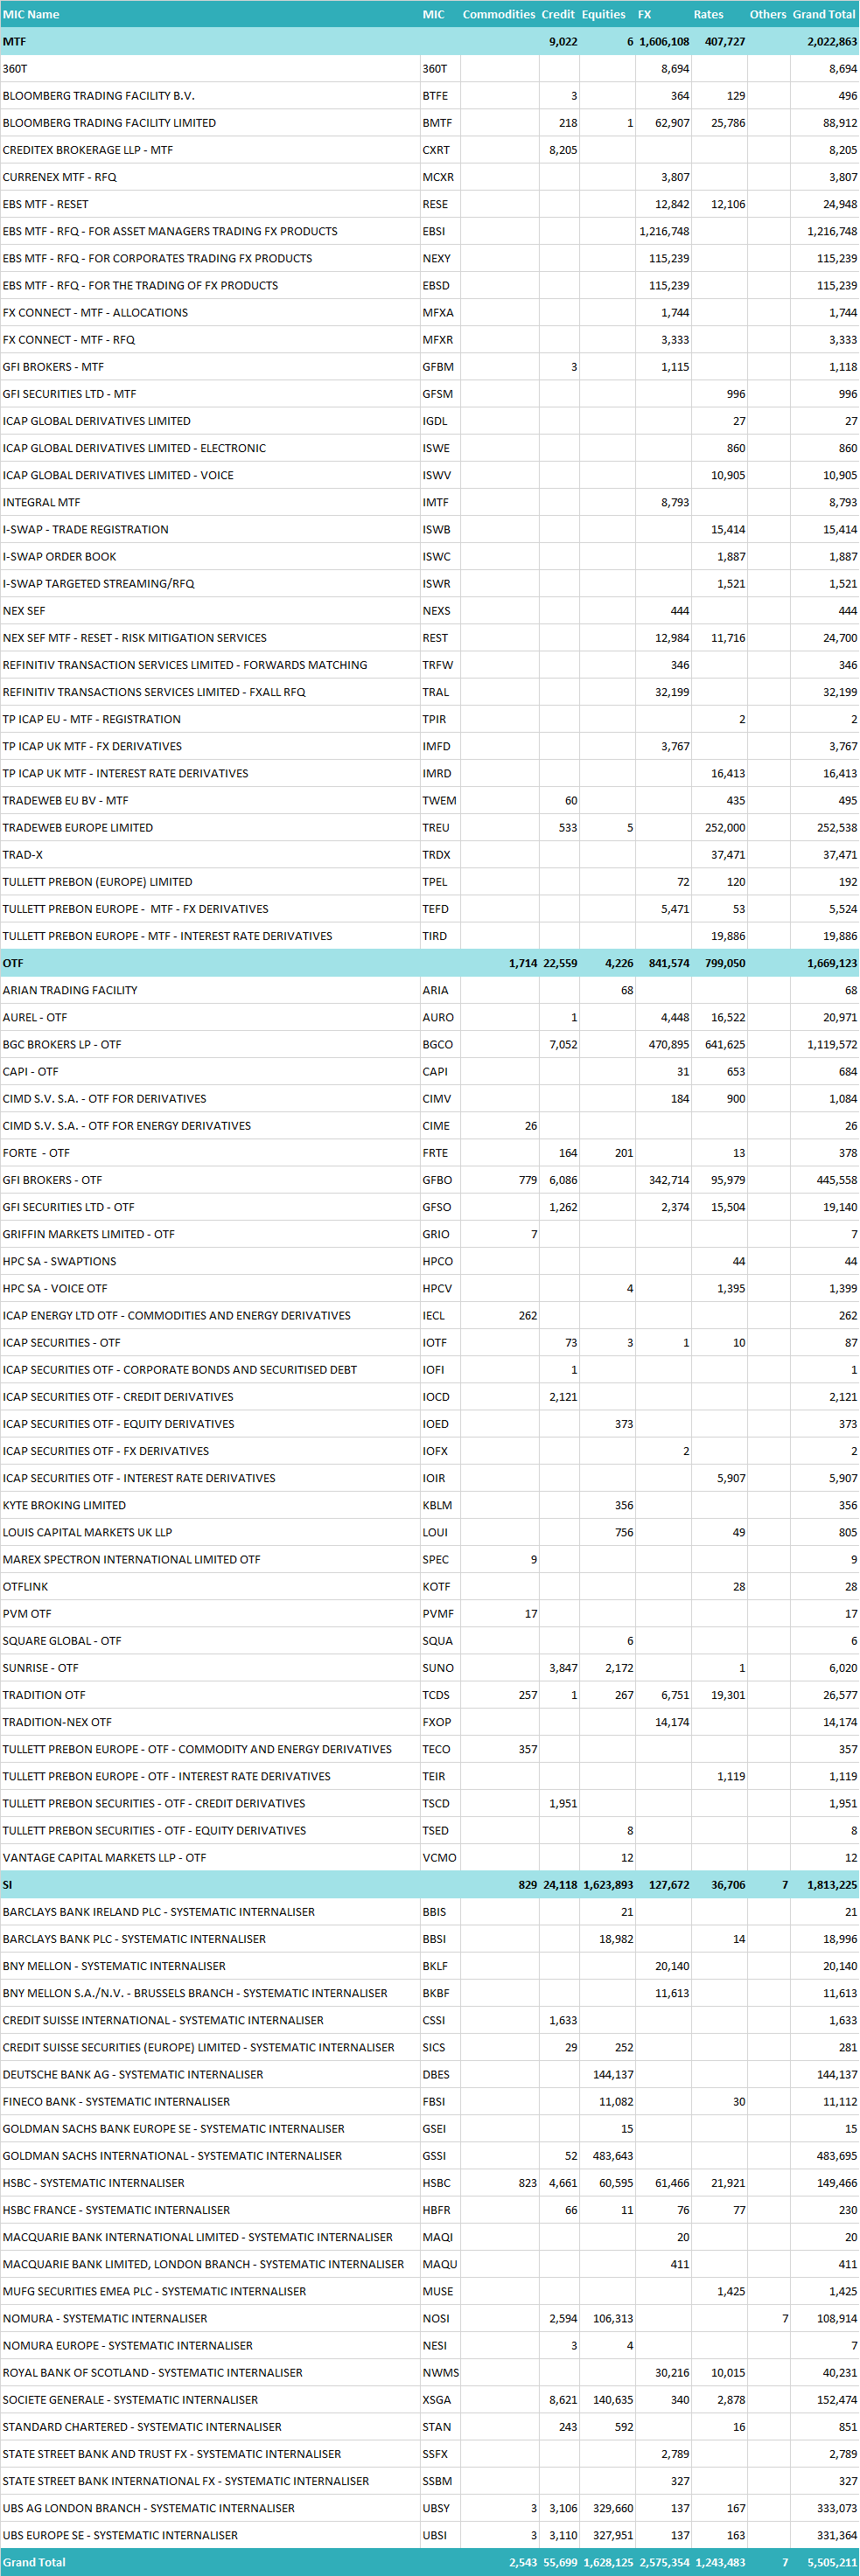
Now on to data about the specific institutions that have submitted data to FIRDS (as at the June 2019 month-end snapshot).
— END —


